
Filter by
Sort By
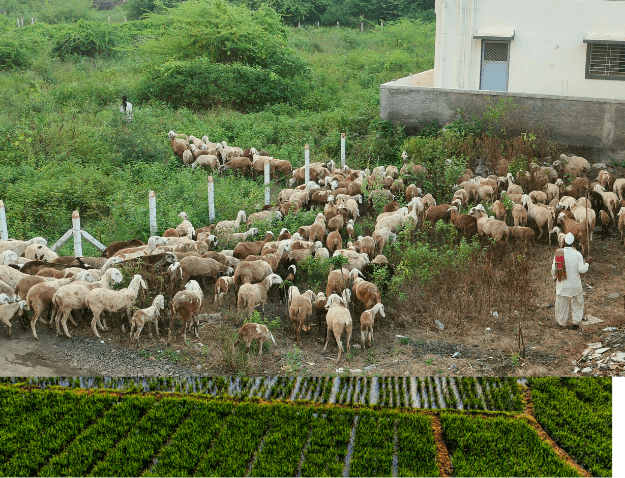
Agriculture
Given the relatively large share of employment in agriculture and allied activities, the sector remains central to India’s overall growth trajectory. Agriculture and allied activities continue to be a key source of livelihoods for a substantial proportion of the population and contribute significantly to national income and employment generation. Over the past decade, however, there has been considerable variation in the growth of agricultural and allied Gross State Domestic Product across states. Understanding the reasons behind these differences is particularly important in the context of structural transformation within the sector. While the key feature of economic development is a gradual employment shift towards manufacturing and services, this transition requires structural transformation within the agriculture and allied sectors, where higher-value allied activities such as livestock, fisheries, and horticulture play an increasingly important role (Negi et al, 2021). This note examines the growth performance of agriculture and allied activities across states over the last decade and a half and examines the contribution of sub-sectors to overall growth. The note goes on to discuss potential factors that may help explain why growth has been faster in some states than in others.
The analysis uses the State Domestic Product (SDP) series from 2011-12 to 2024-25, published by the Ministry of Statistics and Programme Implementation, Government of India. The sub-sectors are crop (agriculture), livestock, forestry, and fisheries. I compute annual growth rates using this series. In addition, I also calculate the contribution of each sub-sector to overall growth in agriculture and allied activities using the sub-sector SDP data. This note summarizes the cross-state growth experience over the past 14 years and decomposes aggregate agriculture and allied growth into sectoral drivers using a baseline-share weighted formula. Each sub-sector’s contribution is calculated as the product of its baseline share and its estimated growth rate. I use 2013 as the baseline year for sectoral decomposition. I group the northeastern states, i.e., Arunachal Pradesh, Assam, Manipur, Meghalaya, Mizoram, Nagaland, Sikkim, and Tripura, into a single composite category in the analysis.
I begin by documenting the well-established empirical fact that state-level growth in total domestic product is positively associated with growth in agriculture and allied activities. Despite the declining share of agriculture in aggregate output, the agriculture and allied sector continues to play a critical role in driving overall income growth across states. Figure 1 illustrates this positive relationship, showing that states experiencing faster growth in agriculture and allied domestic product also tend to record higher growth in overall state GDP. This pattern shows the continued importance of agricultural performance for overall economic growth at the state level.
Figure 1: Relationship between growth in total domestic product and growth in agriculture and allied activities across states

Notes: The figure presents the annual growth in total State Domestic Product and growth in sectoral Agriculture and Allied Gross State Domestic Product (GSDP) across states. Growth rates are computed as compound annual growth rates over the 14-year period from 2011–12 to 2024–25, using the State Domestic Product (SDP) series published by the Ministry of Statistics and Programme Implementation (MoSPI).
Figure 2: Growth in agriculture and allied State Domestic Product across states

Notes: Figure presents the average annual growth rate of Agriculture and Allied Gross State Domestic Product (GSDP) across states, measured at constant 2011–12 prices. Growth rates are computed for the 14 years from 2011-12 to 2024-25 using the State Domestic Product (SDP) series published by the Ministry of Statistics and Programme Implementation (MoSPI) and represent compound annual growth rates over the 14 years.
Figure 2 shows that there is substantial variation in the growth rates of agriculture and allied activities across states. While the all-India average is around 4 percent, states like Andhra Pradesh (7.7 percent), Madhya Pradesh (6.5 percent), Telangana (5.6 percent), and Assam (5.5 percent) turn out to be top performers with a relatively high growth in the range of about 5 to 8 percent per annum. Another group of states, such as Chhattisgarh, Karnataka, and Tamil Nadu, has experienced good growth of around 5 to 5.2 percent. A larger set of states has recorded moderate growth in the range of 3 to 5 per cent, including Gujarat, Odisha, Rajasthan, Uttar Pradesh, Maharashtra, Bihar, West Bengal, Jammu and Kashmir, Haryana, and Bihar. At the lower end, some states like Kerala, Uttarakhand, and the Northeastern states have exhibited negligible or low growth over the period, while Punjab (2.1 per cent) and a few other states have seen relatively muted growth.
Table 1: Sectoral contribution to agriculture and allied growth by states

Notes: The table presents the percentage contribution of individual sub-sectors to growth in Agriculture and Allied Gross State Domestic Product (GSDP) across states, along with the average growth rate of the Agriculture and Allied sector. All estimates are measured at constant 2011–12 prices. Growth rates are computed as compound annual growth rates over the 14 years from 2011–12 to 2024–25, using the State Domestic Product (SDP) series published by the Ministry of Statistics and Programme Implementation (MoSPI). Sub-sectoral contributions are calculated using a baseline-share weighted decomposition, wherein each sub-sector’s contribution is obtained as the product of its baseline share (2013) and the estimated growth rate. Northeastern states, i.e., Arunachal Pradesh, Assam, Manipur, Meghalaya, Mizoram, Nagaland, Sikkim, and Tripura, are grouped into a single composite category.
Table 1 reports the contributions of different sub-sectors to overall growth in the agriculture and allied sector. A key finding is that allied activities like livestock and fisheries have been an important contributor to growth in many states, and their contribution often exceeds the contribution from the crop sector. This aligns with the broader picture that diversification and high-value agriculture will become central to agricultural growth in the future (Birthal et al., 2014; Balaji et al., 2025). It is also consistent with the well documented shift in demand patterns where future growth in demand for agricultural commodities would be driven by high-value commodities such as milk and dairy products, meat, fish, eggs, fruits, and vegetables, rather than by cereals (Singh, 2025). Rising incomes, urbanization, and dietary diversification are therefore likely to amplify the role of livestock and fisheries as engines of agricultural growth, while the relative importance of food crops will continue to decline (Balaji et al, 2025).
A decomposition of growth shows that states with higher overall growth in agriculture and allied activities are also those where livestock and fisheries sectors have made a larger contribution to growth. Livestock has emerged as a particularly important driver of growth in top growing states like Andhra Pradesh, Telangana, Madhya Pradesh, and Rajasthan. The expansion of dairy and animal husbandry has provided a relatively stable source of income, contributing significantly to overall agricultural growth.
Fisheries and aquaculture, while geographically concentrated, have played an important role in some states. States like Andhra Pradesh, Assam, and Odisha, in particular, have recorded strong growth in agriculture and allied activities alongside a rapidly expanding fisheries sector. Despite employing a smaller share of the workforce, fisheries have contributed substantially to growth due to higher productivity and greater domestic and foreign demand.
Forestry has played an important role in some hill and north-eastern states. Forestry has contributed substantially in the Northeastern states, Himachal Pradesh, and Uttarakhand. This partly reflects the fact that these states have relatively large forest resources and therefore have a larger baseline share of forestry value-added in the total agriculture and allied sector.
Figure 2: Relationship between agriculture and allied growth and share of area under cereals

Notes: The figure presents the annual growth in Agriculture and Allied Gross State Domestic Product (GSDP) across states on the vertical axis, along with the proportion of cropped area under cereals in 2013 on the horizontal axis. The state of Kerala is excluded in this figure as an outlier because of its low area under cereals and negligible growth in Agriculture and Allied Gross State Domestic Product over the selected period. Growth rates are computed as compound annual growth rates over the 14-year period from 2011–12 to 2024–25, using the State Domestic Product (SDP) series published by the Ministry of Statistics and Programme Implementation (MoSPI).
In general, the contribution of the crop sector has been relatively modest across many states. Figure 2 reinforces this pattern, showing a negative association between agriculture and allied sector growth and the baseline (2013) share of cropped area under cereals. States with a higher degree of specialization in cereal cultivation tend to exhibit lower overall growth in agriculture and allied activities. This pattern is particularly evident in states with cereal-dominated systems, such as Punjab and Haryana, where crop-sector growth has remained low over the period. The persistence of cereal-centric production in these states is also associated with a relatively high dependence on public procurement mechanisms (Negi et al., 2021; Negi, 2025).
The exception is Madhya Pradesh, where relatively high growth in agriculture and allied activities (6.5 per cent) is largely accounted for by the crop sector. The pattern observed for Madhya Pradesh is consistent with evidence from the literature, which attributes this crop sector-led growth to factors such as expanded irrigation coverage (including canals and tube wells), improved availability of power, and relatively supportive procurement and market conditions (Gulati et al., 2017).
Taken together, these patterns suggest that states with a high concentration in cereal-centric cropping systems have experienced relatively slower growth, while diversification towards non-cereal crops and allied activities has been associated with stronger overall growth in agriculture and allied activities.
India’s agricultural growth has increasingly been associated with diversification away from staple cereals toward high-value sectors such as livestock, fisheries, and horticulture. This structural shift has been driven by rising incomes, rapid urbanization, and dietary change, along with supply-side investments and technological improvements in production, marketing, and value chains (Birthal et al., 2014; Birthal et al., 2020; Negi et al., 2021). The key observation is that states that have been able to expand allied sectors in line with their natural and geographical advantages have experienced faster growth. Prominent examples include forestry-led growth in hilly and northeastern states, as well as the expansion of fisheries and aquaculture in coastal states and those endowed with favorable water and marine resources.
In contrast, states where agricultural growth has historically been driven by the cereal sector have generally observed moderate or low growth and now face an increasing need to diversify into high-value crops and greater investment in the livestock sector. Livestock often complements the crop sector through the use of crop residues as feed and manure for soil fertility, while providing income flows. Therefore, livestock and animal husbandry are not merely a supplementary activity to agriculture but are central to enhancing rural incomes and reducing vulnerability, particularly for smallholders (Birthal & Negi, 2012).
States where fisheries have emerged as a major contributor tend to be those that have successfully scaled aquaculture, developed marketing and logistics infrastructure, and integrated with domestic and export markets. Evidence from Andhra Pradesh illustrates how aquaculture commercialization can add to growth in agriculture and allied value-added.
Finally, lower agriculture and allied growth in major agricultural states like Punjab and Haryana is consistent with the view that the rice-wheat production system faces severe constraints, particularly groundwater depletion and rising costs. The literature documents how procurement-linked cereal systems in north-west India have contributed to environmental stress, reinforcing the need for crop and activity diversification (Negi, 2025).
23 April, 2026

Macro & Public Finance
by Arnav Akhaury, Atin Mittal, Saksham Sarda, Dersh Vinod Savla, Sanah Tripathi
India’s cities are the driving force of the nation’s growth, places where innovation, opportunity, and economic energy thrive. Yet the local institutions meant to sustain these engines run on fumes. Urban Local Bodies (ULBs), the city governments at the heart of this momentum, are perpetually short of funds and struggle to keep pace with fast growing urban needs. Cities contribute to over 60% of India’s GDP (The World Bank, Urbanization in India). But all municipal bodies combined raise only around 0.6% of GDP in revenues (Reserve Bank of India, Report on Municipal Finances). By comparison, the central government mobilises 9.2% and state governments 14.6% (Reserve Bank of India, Report on Municipal Finances). This structural imbal ance leaves municipal bodies heavily dependent on outside support. In many cases, 30 to 40% of their income comes from irregular and conditional transfers from higher levels of government (Reserve Bank of India, Report on Municipal Finances). The consequences are visible in damaged roads, ageing water systems, and overcrowded housing. The World Bank estimates that bridging India’s urban infrastructure gap will require about 840 billion dollars over the next 15 years (The World Bank, Financing India’s Urban Infrastructure Needs), far be yond what grants alone can cover. This policy brief examines the persistent weaknesses in municipal finance within the Indian context while proposing a framework for urban fiscal strengthening. In order to ascertain an India-specific structure, we analyse the United States urban finance market and propose reforms that are tailored to India’s unique operational realities, emphasising mechanisms such as Special Purpose Vehicles (SPVs), Public Private Partnerships (PPPs), and ring-fenced revenue bonds. We conclude that the successful implementation of these instruments is predicated upon the establishment of firm governance structures. This, combined with fiscal innovation and improved fiduciary oversight, will develop institutions necessary for municipalities to access and utilise capital markets. Addressing this current deficiency will create a sustainable financial ecosystem capable of funding the future development and expansion of India’s urban centres.
01 April, 2026

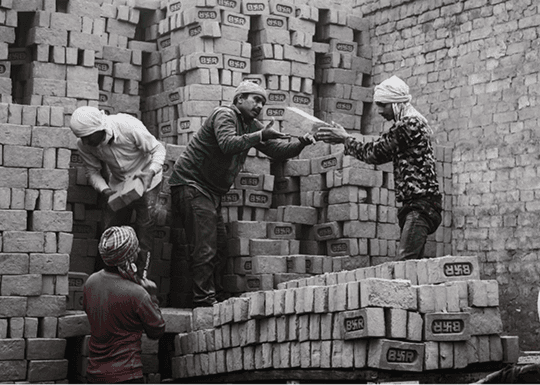
Employment
by Manu Wilson, Arjun Paul, Avani Goenka, Bhoomika Agarwal, Mihir Khanna
Artificial intelligence (AI) has been emerging as a major technological force with the potential to transform labor markets across various industries and occupations. As AI’s ability to perform routine tasks increases, concerns regarding how technological innovation may affect labor demand and employment across different economies have grown. Past empirical research on large exogenous economic shocks provides useful frameworks for studying their macroeconomic effects. For example, Autor, Dorn, and Hanson (2013) show that U.S. regions more exposed to Chinese imports experienced larger job losses and labor market disruptions. Their findings demonstrate how differences in economic structure can cause global shocks to have heterogeneous labor-market effects.
Our empirical study applies a similar framework to the global expansion of artificial intelligence since 2018, and especially to the expansion of large language models after 2022. These developments represent major technological shifts influencing labor demand across occupations and sectors. This leads to our research question: How does exposure to artificial intelligence affect unemployment across countries, and do countries with higher AI exposure experience differential labor-market outcomes following the diffusion of AI technologies after 2018 and the expansion of large language models after 2022?
To answer this question, we adopt an interaction framework inspired by Rajan and Zingales (1998) and use cross-country differences in occupational composition to measure structural exposure to AI. If AI affects labor demand, countries whose employment structures are more concentrated in AI-exposed occupations should experience greater unemployment changes.
08 March, 2026

Macro & Public Finance
by Myra Agrawal, Vaibhav Jain, Rachit Kedia, Saanvi Magod, Vibhu Singh
The COVID-19 pandemic caused a major expansion in government spending worldwide, forcing many countries to either exceed or abandon their existing fiscal rules. Fiscal rules are limits on budget deficits, public debt, or government expenditure made to control long-term fiscal discipline and reassure investors about the stability of public finances. However, the scale of the pandemic shock meant that following these rules was not feasible. The governments of Emerging Markets and Developing Economies (EMDEs) chose to prioritize economic stabilization over meeting fiscal targets as emergency expenditure surged exponentially. Most fiscal frameworks include escape clauses that allow governments to deviate from fiscal rules temporarily. These are exercised during extraordinary events such as recessions, financial crises, or natural disasters. Escape clauses serve to provide fiscal flexibility, specifying that deviations should be temporary and followed by a return to pre-crisis rules as conditions ease. During the COVID-19 crisis, most countries formally invoked these clauses, effectively suspending fiscal constraints to accommodate emergency spending. The activation of escape clauses raises an important question about fiscal credibility, that is, how quickly and credibly governments return to fiscal discipline after the crisis. Correction mechanisms strengthen escape clauses by dictating how and when countries return to pre-crisis fiscal rules. In this policy proposal, we use the reference of the escape clause and the subsequent reliance on correction mechanisms to measure fiscal discipline.
08 March, 2026
Employment
India has a labour problem: youth unemployment rates of about 10 percent, farm jobs still employing at least 40 percent of the workforce, and a need to create at least 8-10 million non-farm jobs annually to absorb the growing young population (Economic Survey, 2023). At the same time, the proportion of India’s workforce in manufacturing has stagnated at about 13 percent for the last three decades. What explains this stagnation?
After liberalisation, the relative price of capital goods fell sharply following trade liberalisation and import tariff cuts, while real wages rose more moderately. This resulted in a rising wage-to-rental price of capital (w/r) ratio and capital deepening. Indian firms now tend to use less labour per unit of capital than firms in other countries at similar income levels, especially in labour-intensive industries like apparel.
Commensurately, labour’s share of value added in India’s organised manufacturing declined from 28.5 per cent in 1980–81 to 11 per cent in 2012–13. While this mirrors the global pattern of falling relative prices of capital goods and capital deepening, India stands out in having unusually low labour intensity for a low-wage economy. Firm size in India remains small, with almost 80 percent of the non-farm workforce employed in firms with fewer than 10 workers. Even among registered manufacturing firms, the median firm size is around 20 workers.
India has long had a labyrinthine labour law regime—over 40 central and 100 state laws dealing with different aspects of wages, industrial disputes, safety and social security. In 2002, the Second National Commission on Labour had recommended consolidation of labour laws to reduce complexity and inconsistent definitions.
Finally, India’s four new labour codes, notified between 2019 and 2020 and brought into force from 21 November 2025, replace 29 central labour laws with a consolidated framework covering wages, industrial relations, social security and occupational safety. Importantly, the new codes attempt to balance the need for worker protection with ease of doing business.
Some crucial changes which aim to enhance worker welfare: a single definition of “wages” across laws, a national floor wage set by the Centre, minimum wage coverage extended from scheduled employments to all workers, common norms on working hours, safety, welfare facilities and registration for establishments, fixed-term employees (FTE’s) to now receive parity of wages and benefits with permanent workers, and appointment letters are now made mandatory for workers making it possible to track employment histories and nudging formalization. Finally, the codes provide for the creation of a Social Security Fund for unorganised, gig and platform workers. Aggregators (ride-hailing, food delivery, e-commerce, etc.) are required to contribute 1-2 percent of their annual turnover, capped at 5 percent of the amount they pay or owe to gig and platform workers.
Major changes which have reduced compliance costs for employers include: the applicability of standing orders and the requirement for government permission for employee layoffs increasing from 100 to 300 employees, a clearer framework for negotiating with unions, with minimum worker representation, and the removal of restrictions on women working at night or in certain occupations. There has been a substantial reduction in registrations, licences and returns. For example, the Occupational Safety, Health and Working Conditions Code has reduced registrations from 6 to 1, licences from 4 to 1, and returns from 21 to 1; the Code on Wages has reduced forms from 20 to 6 and registers from 24 to 2; and the Industrial Relations Code has reduced forms from 37 to 18 and registers from 3 to 0. Though they still fall short of one registration and one return benchmark for all labour related matters.
Most importantly, there has been decriminalisation of minor offences, with fines and improvement notices replacing prosecution. Size-based regulatory thresholds (10, 20, 50, 100 workers) often triggered additional regulations and inspections and were strongly associated with bribe seeking by inspectors. The new web-based random inspections can further reduce compliance costs for firms. However, serious, repeated or critical breaches are still imprisonable offences.
Evidence over the last two decades has repeatedly underscored that India’s manufacturing growth has been stymied by its extensive labour regulations. Evidence shows that states with more flexible labour regulations have higher output, employment, investment and productivity growth in manufacturing, especially in labour intensive industries. In fact, product-market liberalisation increased productivity in states with more flexible labour laws but had little effect in rigid states, implying that labour regulation constrained firms’ ability to respond to new opportunities. Estimates show that regulations under the Factories Act increase firms’ unit labour costs by almost 35%.
More recently, our research shows that amendments that raised Industrial Disputes Act and Factories Act thresholds from 100 to 300 workers, and 10 to 20 and 20 to 40 workers, along with decriminalization of offences in some states over the last decade (also some major changes implemented in the new codes), increased plant employment and output by 5 percent in states which amended these laws relative to the others. Overall, there is sufficient evidence to show that rigid employment protection legislation and complex labour regulations have depressed firm growth and job creation in India’s organised manufacturing.
First, the change that has provoked the strongest backlash from labour unions is the increase in the threshold from 100 to 300 workers for requiring government permission to lay off workers. This is due to fears of employment losses. However, notably, about 15 states, including some large ones like Rajasthan, Madhya Pradesh, Uttar Pradesh, Maharashtra, Andhra Pradesh and Gujarat, had already amended their Industrial Disputes Acts over the last decade (some spurred after the pandemic) and increased the threshold beforehand.
Thus, the effect of this change on manufacturing employment will be marginal in most states. In fact, by spurring firm growth and entry, there will be a net creation of jobs rather than job losses. When separation is costly or unpredictable, firms choose capital-intensive technologies to avoid adjustment risk, even in labour-abundant economies. By making separations more predictable and less binding at lower levels of employment, the codes can reduce the option value of staying small and capital-intensive.
Second, complex regulation and high firing costs act like a tax on labour, raising its effective price relative to capital. Relaxing these, by simplifying compliance and through decriminalization, digital registration, and unified returns, reduces the effective wage component. This makes labour relatively more attractive at the margin than capital. It also reduces harassment, transaction and compliance costs for most firms. Reduction of legal uncertainty can also increase private investment. However, the culture of corruption by officials and harassment of firms needs to change on ground for effective realization of gains. Third, requiring FTEs to receive equal pay and benefits as permanent workers, may reduce the incentive to rely excessively on third-party contractors. However, hiring contractual workers may solve a deeper problem e.g. specialization in core business tasks, training, recruitment etc than simply avoiding regulations and to that extent may have a limited effect.
While the above changes make important leaps, some of the provisions carried forward may still make manufacturing in India less attractive than our Asian competitors. For instance, overtime is fixed at twice the nominal wage. The standard overtime rate is typically 1.5 times the regular wage rate across most countries. The ceiling on the number of hours at 48 hours per week for a worker also makes labour more expensive, especially for industries which may experience seasonal demand. China legally sets 44 hours but often sees long hours. Similarly, Vietnam has a 48-hour limit but allows significant overtime (up to 300 hours per year) at a lower wage premium.
To bring some cheer, overtime capped at 75 hours a quarter has now been left to the discretion of states. Since 2020, some states like Haryana, Himachal Pradesh, Karnataka, Maharashtra, Odisha, Punjab, and Uttar Pradesh have increased the ceiling of overtime hours up to 144 hours per quarter. This potentially increases earnings for employees but high over time rates may still deter firms from employing labour beyond the usual 8-hours.
Second, a common national minimum wage floor in India—-generally considered a good idea for ensuring basic income security and reducing inequality—-can increase cost of labour in some states (especially the ones which already have a small non-farm sector). In India, the cost of living varies significantly between urban and rural areas, and across different states. A single, uniform national rate, even as a floor (unless taken as the minimum across the states currently) may be problematic given the large economic disparities.
Lastly, even if the new codes work as intended, manufacturing investment decisions depend on a broader package: logistics, power and infrastructure costs relative to peers, trade policy,export ecosystem, skilled labour, contract enforcement and importantly, land availability with little delays.
Comparative analyses of India’s manufacturing under-performance emphasise that while labour regulation is important, it is only one among several constraints. While the new labour codes improve India’s attractiveness for manufacturing investors at the margin, they are unlikely to be a silver bullet. Their impact will be realised only if accompanied by complementary reforms and credible implementation at the state level.
09 December, 2025
Agriculture
by E. Somanathan, Eshita Gupta, Praveen Kumar
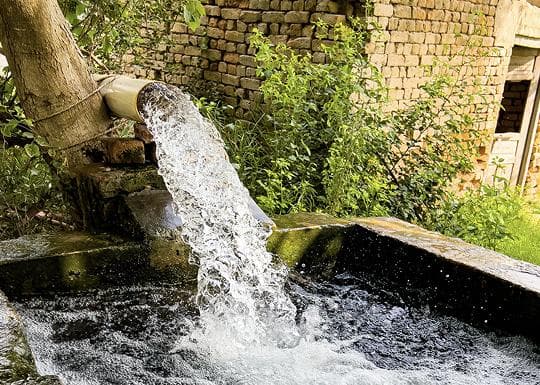
Unrestricted, and free power supply drives higher electricity and groundwater use.
Power use in Telangana rose by over 50% after 24-hour supply.
Rice area expanded by 60% in kharif and 30% in rabi, reflecting greater groundwater use.
Monitoring wells failed to detect depletion, showing gaps in current systems.
Recommendations: Strengthen groundwater monitoring in hard rock aquifer regions and redesign incentives so that power and groundwater are used efficiently.
Electricity is one of the most critical inputs for groundwater-based irrigation in India, where tubewells account for nearly two-thirds of the irrigated area and drive much of agricultural production. Since electricity is supplied to farmers at a monthly fixed cost (implying zero marginal cost) in nearly all states, most states ration the number of hours of supply to avoid overuse of both electricity and groundwater. In January 2018, Telangana became the first state in India to extend free agricultural electricity supply from nine to 24 hours a day. The policy was piloted in three districts in July 2017 before state-wide implementation. The policy was piloted in July 2017 in three districts. This unique policy shift created a natural experiment to understand the implications of unrestricted electricity supply for power consumption and groundwater, particularly in a region dominated by hard rock aquifers.
This policy brief addresses three central questions. First, how much did agricultural power consumption increase when rationing was removed? Second, did the policy lead to a rise in water extraction as well as groundwater depth? Third, are current groundwater monitoring systems capable of detecting the change in groundwater availability for farmers? The relevance of these questions is heightened by two factors. First, rationed electricity is the dominant irrigation power policy across India. Removing rationing is therefore a significant policy departure with potential consequences for the power sector, groundwater resources, and agricultural outcomes. Second, Telangana’s geology is characterized by spatially fragmented hard rock aquifers with low storage capacity, making groundwater highly vulnerable to over-extraction and low recharge. Notably, hard rock aquifers account for about 60% of those in India and 20% worldwide. Figure 2 illustrates the fragmented nature of hard rock aquifers. Understanding the effects of twenty-four hour power supply in this context can inform water and energy policy in similar regions across India and other countries.
To evaluate the impact of Telangana’s policy, we constructed a monthly district-level panel dataset covering January 2014 to December 2019 for agricultural power consumption in Telangana and in neighboring districts in Andhra Pradesh, Karnataka, and Maharashtra. We also compiled a detailed monthly panel of groundwater depth from monitoring wells located within 5 to 32 kilometers of the state boundary (see Figure 1 for visual clarity), along with weather variables such as precipitation and temperature. Our methodology comprises comparing outcomes in very similar locations where one location in Telangana (with 24 hour power supply to agriculture) being compared to a close neighbor outside Telangana without that policy. This comparison makes it possible that other factors affecting the outcomes like aquifer characteristics, agro-climatic suitability and other physical conditions are accounted for, helping to isolate the impact of Telangana policy per se.
Figure 1: Monitoring wells spanning 5 to 32.18 km on both sides of the boundary segments

Notes: There are 1,658 monitoring wells located within 5 to 32.18 km on both sides of the boundary segments, as indicated by red dots within the hatched lines. There are 21 Telangana boundary segments, indicated by blue and black colors. The lengths of the segment curves range from 97 km to 105 km. We exclude the state of Chhattisgarh, located to the northeast of Telangana, because of insufficient data.
Source: State shapefile is downloaded from gadm.org. Monitoring well data is downloaded from INDIAWRIS.
The results reveal a huge increase in agricultural electricity consumption following the removal of rationing. Agricultural power use in Telangana rose by approximately fifty-three percent relative to neighboring states, and this increase appeared in two years post-policy, indicating that farmers quickly responded to the availability of unrestricted electricity by increasing their pumping. We also observe a sharp expansion in the area under rice cultivation—a major and water-intensive crop—during both the kharif (60%) and rabi (30%) seasons. This means that groundwater use has definitely increased, since rice cultivation in Telangana relies predominantly on tubewell irrigation. However, when we examine groundwater depth using the government’s monitoring well network, we do not find a statistically significant change in groundwater depth in the two years following the policy, which is robust to accounting for increase in procurement infrastructure, surface water expansion, and a set of robustness checks. Nor do we find evidence of a rise in the fraction of missing observations in the monitoring data, which could have served as an indirect indicator of wells running dry. These apparently contradictory findings—large increases in electricity use and rice area without a decline in groundwater levels in monitoring wells—can be reconciled by recognizing the limitations of the monitoring network.
Government monitoring wells are intentionally located away from farmer wells to avoid local drawdown effects. In the context of Telangana’s highly localized hard rock aquifers, such wells can be disconnected from the farmer wells that are actually used for irrigation. Consequently, they may fail to detect depletion that directly affects outcomes of economic interest.
A figure from hydrogeology studies (Figure 2) by Guih´eneuf et al. (2014) and Mar´echal et al. (2018) that focus on the Experimental Hydrogeological Park (EHP) in the Nalgonda district of Telangana and the Maheshwaram watershed near Hyderabad in Telangana, respectively, clearly illustrates the discontinuous/fragmented nature of the aquifer during the pre-monsoon season on a horizontal scale of 200 meters. Additionally, 450 borewells, covering an area of approximately 20km2in Karnataka state (based on a figure from Blakeslee, Fishman, and Srinivasan (2020)), include a mix of active and dry wells with some right next to each other, we infer that the hard rock aquifer even in this small region is not well-connected. Field visit conducted as part of this study in Telangana, confirms this fragmentation in hard rock aquifers.
Figure 2: Groundwater flow diagram showing discontinuous aquifer in pre-monsoon period

Notes: There are 1,658 monitoring wells located within 5 to 32.18 km on both sides of the boundary segments, as indicated by red dots within the hatched lines. There are 21 Telangana boundary segments, indicated by blue and black colors. The lengths of the segment curves range from 97 km to 105 km. We exclude the state of Chhattisgarh, located to the northeast of Telangana, because of insufficient data.
Source: Mar´echal et al. (2018)
We did not explicitly examine water trade, as it was not evident from general media. Our field visits to border villages in northern and southern Telangana in December 2022 also did not reveal signs of water trade. However, systematic evidence is lacking, making this an open question for further research.
First, providing electricity at zero marginal cost without rationing encourages overuse of power in agriculture, which is likely to be economically inefficient and contributes to financial stress for state-owned distribution companies. Alluvial aquifers hold more storage than hard rock, but similar inefficiencies could also arise in them, because zero marginal cost pumping under free or fixed-price electricity and unrationed electricity can encourage over-extraction. Free electricity has become a routine election promise in many states, locking utilities and farmers into unsustainable patterns. Well-designed incentives or pricing mechanisms could help ensure that groundwater is used judiciously while still protecting the interests of smallholder farmers.
Second, there is an urgent need to strengthen the groundwater monitoring system in regions with hard rock aquifers. The current practice of monitoring rest water levels at dedicated observation wells may be sufficient in alluvial regions where aquifers are well-connected but fails to capture changes in economically important farmer wells in fragmented aquifers. A redesigned monitoring regime should also integrate a sample of farmer wells into the network, so that observed water levels correspond to the wells that farmers actually depend on. This should include both depth measurements and information on well functionality, such as whether wells have run dry or have reduced yields. Additionally, digital reporting by farmers, combined with appropriate verification by the government could enable real-time tracking of aquifer conditions and support evidence based decision-making. Without such improvements, policy responses to groundwater stress will continue to be based on incomplete information, risking both underestimation of depletion and delayed corrective action.
Note: This policy brief is based on our research paper titled—“Removing Rationing: Power Consumption and Groundwater Monitoring in South India” (Forthcoming in JEEM).
15 October, 2025
Subscribe to our newsletter
Subscribe to our newsletter
©2024-25 Isaac Centre for Public Policy