

Macro & Public Finance • Discussion Paper
by Siddharth Shrimal, Pradnyan Dani
04 June, 2026
Macro & Public Finance • Discussion Paper
by Vidushi Balakrishnan, Zuhaib Bangroo
07 May, 2026
Macro & Public Finance • Discussion Paper
by Dhruv Goel
29 April, 2026
Agriculture • Policy Brief
23 April, 2026
Filter by
Macro & Public Finance • Discussion Paper
by Siddharth Shrimal, Pradnyan Dani
In February 2026, the Ministry of Statistics and Programme Implementation (MoSPI) released a comprehensive revision of India’s national accounts, shifting the base year from 2011–12 to 2022–23 alongside significant methodological reforms. This paper provides a detailed comparative analysis of the old and new GDP series, examining the 3.08% decline in nominal GDP for FY26 and tracing it to improved informal sector measurement (ASUSE), the adoption of double deflation, expanded administrative data sources (GST, LLP filings), and the introduction of Supply–Use Tables. Using implied inflation across sectors as a diagnostic, we decompose sectoral growth into contributions from better data collection and improved deflation methodology — finding that the tertiary sector experienced the most significant downward revision in nominal levels, while manufacturing saw real growth revised sharply upward from 4.5% to 9.3% in FY25, driven primarily by the shift to double deflation. Quarterly data further reveal a more optimistic trajectory for manufacturing than annual figures suggest.
04 June, 2026
Macro & Public Finance • Discussion Paper
by Vidushi Balakrishnan, Zuhaib Bangroo
The US–Israel military operation against Iran in February 2026, which severely disrupted oil traffic through the Strait of Hormuz, drove the Indian Basket crude oil price from US$69 to US$117 per barrel within weeks, a shock of 69 percent. This paper estimates the headline CPI inflation impact of this shock under a range of sustained year-average crude price trajectories and government pass-through stances on petrol and diesel. We extend the Tomar (2019) two-channel decomposition by computing fuel-specific Leontief shares from the 131-sector Chadha et al. (2020) Input–Output table, applying the framework separately to LPG, petrol, and diesel. Across four sustained year-average crude scenarios for 2026–27 (US$100, US$117, US$120, and US$125 per barrel), we find that the LPG revision alone with petrol and diesel frozen adds only 19–23 basis points to year 2026–27 CPI. Partial pass-through of 20–50 percent on petrol and diesel keeps headline CPI within the RBI’s 6 percent upper tolerance band at all four crude levels, but at full passthrough, every scenario at US$117 and above breaches the ceiling, with year 2026– 27 CPI rising to 7.21–7.92 percent. A stress-test scenario at US$150 sustained, in which even 50 percent pass-through breaches the ceiling, is presented in the appendix.
07 May, 2026
Macro & Public Finance • Discussion Paper
by Dhruv Goel
The US–Israel military operation against Iran (February 2026) and Iran’s retaliatory activities including closure of the Strait of Hormuz have triggered a large energy supply shock for India, the world’s third-largest oil importer. This paper provides a bottom-up fiscal accounting of the shock’s impact on the Indian central government’s budget for FY 2025–26 and FY 2026–27. We trace the transmission through five channels: higher fertiliser subsidies (costlier domestic gas, costlier urea imports, costlier DAP imports), higher LPG subsidies, foregone excise rev- enue from the Special Additional Excise Duty (SAED) cut on petrol and diesel, a modest customs duty gain, and foregone petroleum-sector dividends. Under our primary scenario (war through June 2026), the additional fiscal deficit in FY 2026– 27 is Rs. 74,087 crore, pushing the deficit from 4.30% to 4.49% of GDP. In the worst case (war through December), the deficit reaches 4.99% of GDP, a deviation of 0.69 percentage points from the Budget target.
29 April, 2026
Agriculture • Policy Brief
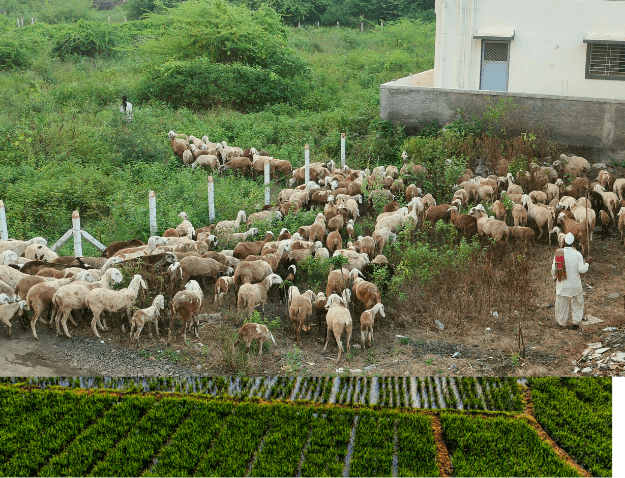
Given the relatively large share of employment in agriculture and allied activities, the sector remains central to India’s overall growth trajectory. Agriculture and allied activities continue to be a key source of livelihoods for a substantial proportion of the population and contribute significantly to national income and employment generation. Over the past decade, however, there has been considerable variation in the growth of agricultural and allied Gross State Domestic Product across states. Understanding the reasons behind these differences is particularly important in the context of structural transformation within the sector. While the key feature of economic development is a gradual employment shift towards manufacturing and services, this transition requires structural transformation within the agriculture and allied sectors, where higher-value allied activities such as livestock, fisheries, and horticulture play an increasingly important role (Negi et al, 2021). This note examines the growth performance of agriculture and allied activities across states over the last decade and a half and examines the contribution of sub-sectors to overall growth. The note goes on to discuss potential factors that may help explain why growth has been faster in some states than in others.
The analysis uses the State Domestic Product (SDP) series from 2011-12 to 2024-25, published by the Ministry of Statistics and Programme Implementation, Government of India. The sub-sectors are crop (agriculture), livestock, forestry, and fisheries. I compute annual growth rates using this series. In addition, I also calculate the contribution of each sub-sector to overall growth in agriculture and allied activities using the sub-sector SDP data. This note summarizes the cross-state growth experience over the past 14 years and decomposes aggregate agriculture and allied growth into sectoral drivers using a baseline-share weighted formula. Each sub-sector’s contribution is calculated as the product of its baseline share and its estimated growth rate. I use 2013 as the baseline year for sectoral decomposition. I group the northeastern states, i.e., Arunachal Pradesh, Assam, Manipur, Meghalaya, Mizoram, Nagaland, Sikkim, and Tripura, into a single composite category in the analysis.
I begin by documenting the well-established empirical fact that state-level growth in total domestic product is positively associated with growth in agriculture and allied activities. Despite the declining share of agriculture in aggregate output, the agriculture and allied sector continues to play a critical role in driving overall income growth across states. Figure 1 illustrates this positive relationship, showing that states experiencing faster growth in agriculture and allied domestic product also tend to record higher growth in overall state GDP. This pattern shows the continued importance of agricultural performance for overall economic growth at the state level.
Figure 1: Relationship between growth in total domestic product and growth in agriculture and allied activities across states

Notes: The figure presents the annual growth in total State Domestic Product and growth in sectoral Agriculture and Allied Gross State Domestic Product (GSDP) across states. Growth rates are computed as compound annual growth rates over the 14-year period from 2011–12 to 2024–25, using the State Domestic Product (SDP) series published by the Ministry of Statistics and Programme Implementation (MoSPI).
Figure 2: Growth in agriculture and allied State Domestic Product across states

Notes: Figure presents the average annual growth rate of Agriculture and Allied Gross State Domestic Product (GSDP) across states, measured at constant 2011–12 prices. Growth rates are computed for the 14 years from 2011-12 to 2024-25 using the State Domestic Product (SDP) series published by the Ministry of Statistics and Programme Implementation (MoSPI) and represent compound annual growth rates over the 14 years.
Figure 2 shows that there is substantial variation in the growth rates of agriculture and allied activities across states. While the all-India average is around 4 percent, states like Andhra Pradesh (7.7 percent), Madhya Pradesh (6.5 percent), Telangana (5.6 percent), and Assam (5.5 percent) turn out to be top performers with a relatively high growth in the range of about 5 to 8 percent per annum. Another group of states, such as Chhattisgarh, Karnataka, and Tamil Nadu, has experienced good growth of around 5 to 5.2 percent. A larger set of states has recorded moderate growth in the range of 3 to 5 per cent, including Gujarat, Odisha, Rajasthan, Uttar Pradesh, Maharashtra, Bihar, West Bengal, Jammu and Kashmir, Haryana, and Bihar. At the lower end, some states like Kerala, Uttarakhand, and the Northeastern states have exhibited negligible or low growth over the period, while Punjab (2.1 per cent) and a few other states have seen relatively muted growth.
Table 1: Sectoral contribution to agriculture and allied growth by states

Notes: The table presents the percentage contribution of individual sub-sectors to growth in Agriculture and Allied Gross State Domestic Product (GSDP) across states, along with the average growth rate of the Agriculture and Allied sector. All estimates are measured at constant 2011–12 prices. Growth rates are computed as compound annual growth rates over the 14 years from 2011–12 to 2024–25, using the State Domestic Product (SDP) series published by the Ministry of Statistics and Programme Implementation (MoSPI). Sub-sectoral contributions are calculated using a baseline-share weighted decomposition, wherein each sub-sector’s contribution is obtained as the product of its baseline share (2013) and the estimated growth rate. Northeastern states, i.e., Arunachal Pradesh, Assam, Manipur, Meghalaya, Mizoram, Nagaland, Sikkim, and Tripura, are grouped into a single composite category.
Table 1 reports the contributions of different sub-sectors to overall growth in the agriculture and allied sector. A key finding is that allied activities like livestock and fisheries have been an important contributor to growth in many states, and their contribution often exceeds the contribution from the crop sector. This aligns with the broader picture that diversification and high-value agriculture will become central to agricultural growth in the future (Birthal et al., 2014; Balaji et al., 2025). It is also consistent with the well documented shift in demand patterns where future growth in demand for agricultural commodities would be driven by high-value commodities such as milk and dairy products, meat, fish, eggs, fruits, and vegetables, rather than by cereals (Singh, 2025). Rising incomes, urbanization, and dietary diversification are therefore likely to amplify the role of livestock and fisheries as engines of agricultural growth, while the relative importance of food crops will continue to decline (Balaji et al, 2025).
A decomposition of growth shows that states with higher overall growth in agriculture and allied activities are also those where livestock and fisheries sectors have made a larger contribution to growth. Livestock has emerged as a particularly important driver of growth in top growing states like Andhra Pradesh, Telangana, Madhya Pradesh, and Rajasthan. The expansion of dairy and animal husbandry has provided a relatively stable source of income, contributing significantly to overall agricultural growth.
Fisheries and aquaculture, while geographically concentrated, have played an important role in some states. States like Andhra Pradesh, Assam, and Odisha, in particular, have recorded strong growth in agriculture and allied activities alongside a rapidly expanding fisheries sector. Despite employing a smaller share of the workforce, fisheries have contributed substantially to growth due to higher productivity and greater domestic and foreign demand.
Forestry has played an important role in some hill and north-eastern states. Forestry has contributed substantially in the Northeastern states, Himachal Pradesh, and Uttarakhand. This partly reflects the fact that these states have relatively large forest resources and therefore have a larger baseline share of forestry value-added in the total agriculture and allied sector.
Figure 2: Relationship between agriculture and allied growth and share of area under cereals

Notes: The figure presents the annual growth in Agriculture and Allied Gross State Domestic Product (GSDP) across states on the vertical axis, along with the proportion of cropped area under cereals in 2013 on the horizontal axis. The state of Kerala is excluded in this figure as an outlier because of its low area under cereals and negligible growth in Agriculture and Allied Gross State Domestic Product over the selected period. Growth rates are computed as compound annual growth rates over the 14-year period from 2011–12 to 2024–25, using the State Domestic Product (SDP) series published by the Ministry of Statistics and Programme Implementation (MoSPI).
In general, the contribution of the crop sector has been relatively modest across many states. Figure 2 reinforces this pattern, showing a negative association between agriculture and allied sector growth and the baseline (2013) share of cropped area under cereals. States with a higher degree of specialization in cereal cultivation tend to exhibit lower overall growth in agriculture and allied activities. This pattern is particularly evident in states with cereal-dominated systems, such as Punjab and Haryana, where crop-sector growth has remained low over the period. The persistence of cereal-centric production in these states is also associated with a relatively high dependence on public procurement mechanisms (Negi et al., 2021; Negi, 2025).
The exception is Madhya Pradesh, where relatively high growth in agriculture and allied activities (6.5 per cent) is largely accounted for by the crop sector. The pattern observed for Madhya Pradesh is consistent with evidence from the literature, which attributes this crop sector-led growth to factors such as expanded irrigation coverage (including canals and tube wells), improved availability of power, and relatively supportive procurement and market conditions (Gulati et al., 2017).
Taken together, these patterns suggest that states with a high concentration in cereal-centric cropping systems have experienced relatively slower growth, while diversification towards non-cereal crops and allied activities has been associated with stronger overall growth in agriculture and allied activities.
India’s agricultural growth has increasingly been associated with diversification away from staple cereals toward high-value sectors such as livestock, fisheries, and horticulture. This structural shift has been driven by rising incomes, rapid urbanization, and dietary change, along with supply-side investments and technological improvements in production, marketing, and value chains (Birthal et al., 2014; Birthal et al., 2020; Negi et al., 2021). The key observation is that states that have been able to expand allied sectors in line with their natural and geographical advantages have experienced faster growth. Prominent examples include forestry-led growth in hilly and northeastern states, as well as the expansion of fisheries and aquaculture in coastal states and those endowed with favorable water and marine resources.
In contrast, states where agricultural growth has historically been driven by the cereal sector have generally observed moderate or low growth and now face an increasing need to diversify into high-value crops and greater investment in the livestock sector. Livestock often complements the crop sector through the use of crop residues as feed and manure for soil fertility, while providing income flows. Therefore, livestock and animal husbandry are not merely a supplementary activity to agriculture but are central to enhancing rural incomes and reducing vulnerability, particularly for smallholders (Birthal & Negi, 2012).
States where fisheries have emerged as a major contributor tend to be those that have successfully scaled aquaculture, developed marketing and logistics infrastructure, and integrated with domestic and export markets. Evidence from Andhra Pradesh illustrates how aquaculture commercialization can add to growth in agriculture and allied value-added.
Finally, lower agriculture and allied growth in major agricultural states like Punjab and Haryana is consistent with the view that the rice-wheat production system faces severe constraints, particularly groundwater depletion and rising costs. The literature documents how procurement-linked cereal systems in north-west India have contributed to environmental stress, reinforcing the need for crop and activity diversification (Negi, 2025).
23 April, 2026

Macro & Public Finance • Policy Brief
by Arnav Akhaury, Atin Mittal, Saksham Sarda, Dersh Vinod Savla, Sanah Tripathi
India’s cities are the driving force of the nation’s growth, places where innovation, opportunity, and economic energy thrive. Yet the local institutions meant to sustain these engines run on fumes. Urban Local Bodies (ULBs), the city governments at the heart of this momentum, are perpetually short of funds and struggle to keep pace with fast growing urban needs. Cities contribute to over 60% of India’s GDP (The World Bank, Urbanization in India). But all municipal bodies combined raise only around 0.6% of GDP in revenues (Reserve Bank of India, Report on Municipal Finances). By comparison, the central government mobilises 9.2% and state governments 14.6% (Reserve Bank of India, Report on Municipal Finances). This structural imbal ance leaves municipal bodies heavily dependent on outside support. In many cases, 30 to 40% of their income comes from irregular and conditional transfers from higher levels of government (Reserve Bank of India, Report on Municipal Finances). The consequences are visible in damaged roads, ageing water systems, and overcrowded housing. The World Bank estimates that bridging India’s urban infrastructure gap will require about 840 billion dollars over the next 15 years (The World Bank, Financing India’s Urban Infrastructure Needs), far be yond what grants alone can cover. This policy brief examines the persistent weaknesses in municipal finance within the Indian context while proposing a framework for urban fiscal strengthening. In order to ascertain an India-specific structure, we analyse the United States urban finance market and propose reforms that are tailored to India’s unique operational realities, emphasising mechanisms such as Special Purpose Vehicles (SPVs), Public Private Partnerships (PPPs), and ring-fenced revenue bonds. We conclude that the successful implementation of these instruments is predicated upon the establishment of firm governance structures. This, combined with fiscal innovation and improved fiduciary oversight, will develop institutions necessary for municipalities to access and utilise capital markets. Addressing this current deficiency will create a sustainable financial ecosystem capable of funding the future development and expansion of India’s urban centres.
01 April, 2026

Employment • Policy Brief
by Manu Wilson, Arjun Paul, Avani Goenka, Bhoomika Agarwal, Mihir Khanna
Artificial intelligence (AI) has been emerging as a major technological force with the potential to transform labor markets across various industries and occupations. As AI’s ability to perform routine tasks increases, concerns regarding how technological innovation may affect labor demand and employment across different economies have grown. Past empirical research on large exogenous economic shocks provides useful frameworks for studying their macroeconomic effects. For example, Autor, Dorn, and Hanson (2013) show that U.S. regions more exposed to Chinese imports experienced larger job losses and labor market disruptions. Their findings demonstrate how differences in economic structure can cause global shocks to have heterogeneous labor-market effects.
Our empirical study applies a similar framework to the global expansion of artificial intelligence since 2018, and especially to the expansion of large language models after 2022. These developments represent major technological shifts influencing labor demand across occupations and sectors. This leads to our research question: How does exposure to artificial intelligence affect unemployment across countries, and do countries with higher AI exposure experience differential labor-market outcomes following the diffusion of AI technologies after 2018 and the expansion of large language models after 2022?
To answer this question, we adopt an interaction framework inspired by Rajan and Zingales (1998) and use cross-country differences in occupational composition to measure structural exposure to AI. If AI affects labor demand, countries whose employment structures are more concentrated in AI-exposed occupations should experience greater unemployment changes.
08 March, 2026
Subscribe to our newsletter
Subscribe to our newsletter
©2024-25 Isaac Centre for Public Policy